
Reconstructing the Context of Our Frequent Finds
When we began transferring the mounds of Temple Mount material from the Kidron Valley dump to the Tzurim Valley National Park, we divided the dump into various areas. We suspected that the order of the removal of the earth from the Temple Mount and the location of its dumping may correlate somehow to the way it was excavated. We also separated the marginal areas of the material from the internal areas that had not been disturbed by the other illicit dumps in the Kidron Valley. The Temple Mount material was eventually divided to 11 areas that were removed separately.
Early in the Sifting Project, we already noticed that there were differences in the frequencies of certain types of finds from different areas. Moreover, similar finds, and sometimes fragments of the same object, were discovered within short periods of time. This suggested that these similar objects were originally next to each other. But the full significance and value of dividing the material at the dump into different areas was discovered only last summer, during the processing of quantitative data for the Third Preliminary Report which we recently published. We found that artifacts which we assume to be from the same context were also distributed in a similar manner. Another example is that we found that artifacts which can be identified with the Horses of the Crusader era Templar Knights were distributed in a similar way among the dump areas.
We concluded from this that we can define a statistical distribution “fingerprint” for each artifact type. Artifacts that have a similar “fingerprint” may have originated from the same context. The statistical technique for finding such relationships and verifying their statistical significance is called Cluster Analysis.We will not go into a detailed explanation of this technique, but we can foresee that at the completion of the classification and sorting process of all the different types of finds that we have, we will be able to apply this technique on a unified data table of all the finds. The results of this analysis will show clusters of finds having similar distributions. These clusters may also represent a similar context of the finds within them. Currently, we are still investigating the application and implication of this method. Only after finishing the classification and sorting process, will we be able to create a full data table that will be adequate for such an analysis, and then we will be capable of fully estimating the value of this method. If we are able to achieve valuable information from this type of analysis, it will be a substantial innovation in archaeological method and theory research which could also be applied by other archaeologists who focus their research on excavations of fillings or site surveys.
We can illustrate this idea using the following example:
Suppose we prepare a salad using four vegetables and two cutting boards. On one board we cut cucumbers and tomatoes, and on the other carrots and onions. The vegetables on each cutting board are thoroughly mixed and placed in a large bowl. They are then lightly tossed in the bowl. Such a mixture will result in the vegetables being scattered unevenly throughout the salad. It can be assumed that the distribution of vegetables that we cut and mixed on each board will show a similar distribution within each of the various areas of the salad. Let’s further illustrate this with the following table:
Board 1: 21 cucumber pieces and 11 tomato pieces (32 total pieces)
Board 2: 6 onion pieces and 12 carrot pieces (18 total pieces)
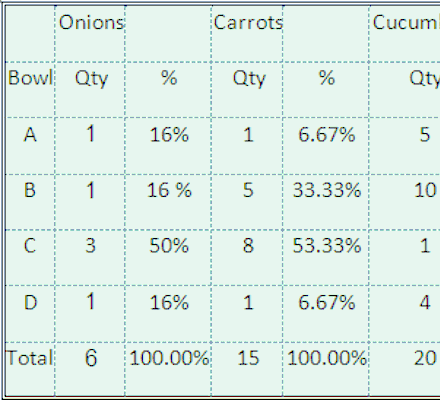
Mix the cut vegetables well on each cutting board and then combine them together in a large bowl. The vegetables in the large bowl are lightly tossed and then its contents are divided equally into 4 smaller bowls. This procedure may yield the following data table:
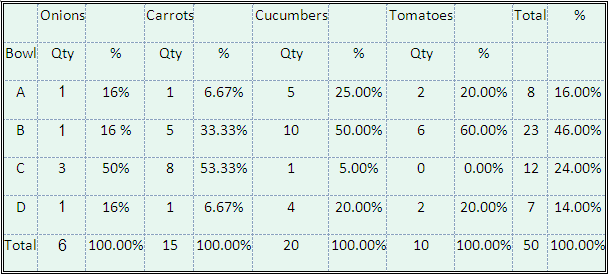
It can be seen in the table that the distributions of the carrots and the onions within each bowl are similar, but differ from the distributions of the cucumber and the tomatoes in the corresponding bowl and vice versa.
This is the value of “cluster analysis.” By observing the percentages of various types of finds within each area, we may be able to determine which types of finds originated from the same context.
Discover more from The Temple Mount Sifting Project
Subscribe to get the latest posts sent to your email.


Sounds like the development of a very strategic method to sort and categorize findings, enabling for a more accurate and detailed picture to emerge about specific time periods! Very pains taking but very exciting when picture comes into view! Praise you in your efforts!
Will you make the data available for other types of analytical analyses? Perhaps the data could be used to develop predictive models that might point to correlations between historically significant finds and dump locations as targets for sifting.
Our family participated last summer on a sift and they are all eager to do it again.
It will be available for other analytical analyses, but it will be limited and not be able to contribute to the questions you mentioned.
The only problem I see with this method is that when dirt is moved several times, each time it is moved it stratifies itself with the heavier material going to the bottom and the lighter material being layered as you go up according to it’s weight. I don’t see how this could help archeologists determine dates & how they relate to ancient artifacts. Your illustration of the salad is a great point. The more you toss a salad the more the larger & heavier pieces go to the bottom. Tossing a salad taking that has the larger veggies on the bottom will cause a bit of mixing of dissimilar veggies but tops it enough & it will stratify itself. So what would be the benefit. What am I missing here.
Joseph, you are correct, and we could also see this phenomenon in our dirt heaps. Heavier items tend to be in the bottom. But still keep in mind that we are dealing mainly with small items (up to 4cm big).
Anyhow, the problem you mention is minor to the fact that stratified context, and the clustered items, we’re all moved using heavy machinery several times. This fact itself caused the main disturbance of the context of the finds. My point was that even though, still the dirt was not thoroughly mixed. If you don’t toss the Salad to much then the vegetables will not be evenly distributed. Your point is that as much as you toss it the distribution become even more uneven because of the different weight of items, but this kind of uneven distribution (heavier at the bottom and light at the top) does not help us trace original contexts, and will not yield significant clusters of item with similar distributions. We might find that heavier items are clustered in the areas that were deeper in the Kidron Dump, but it will show up as a very vague single cluster.